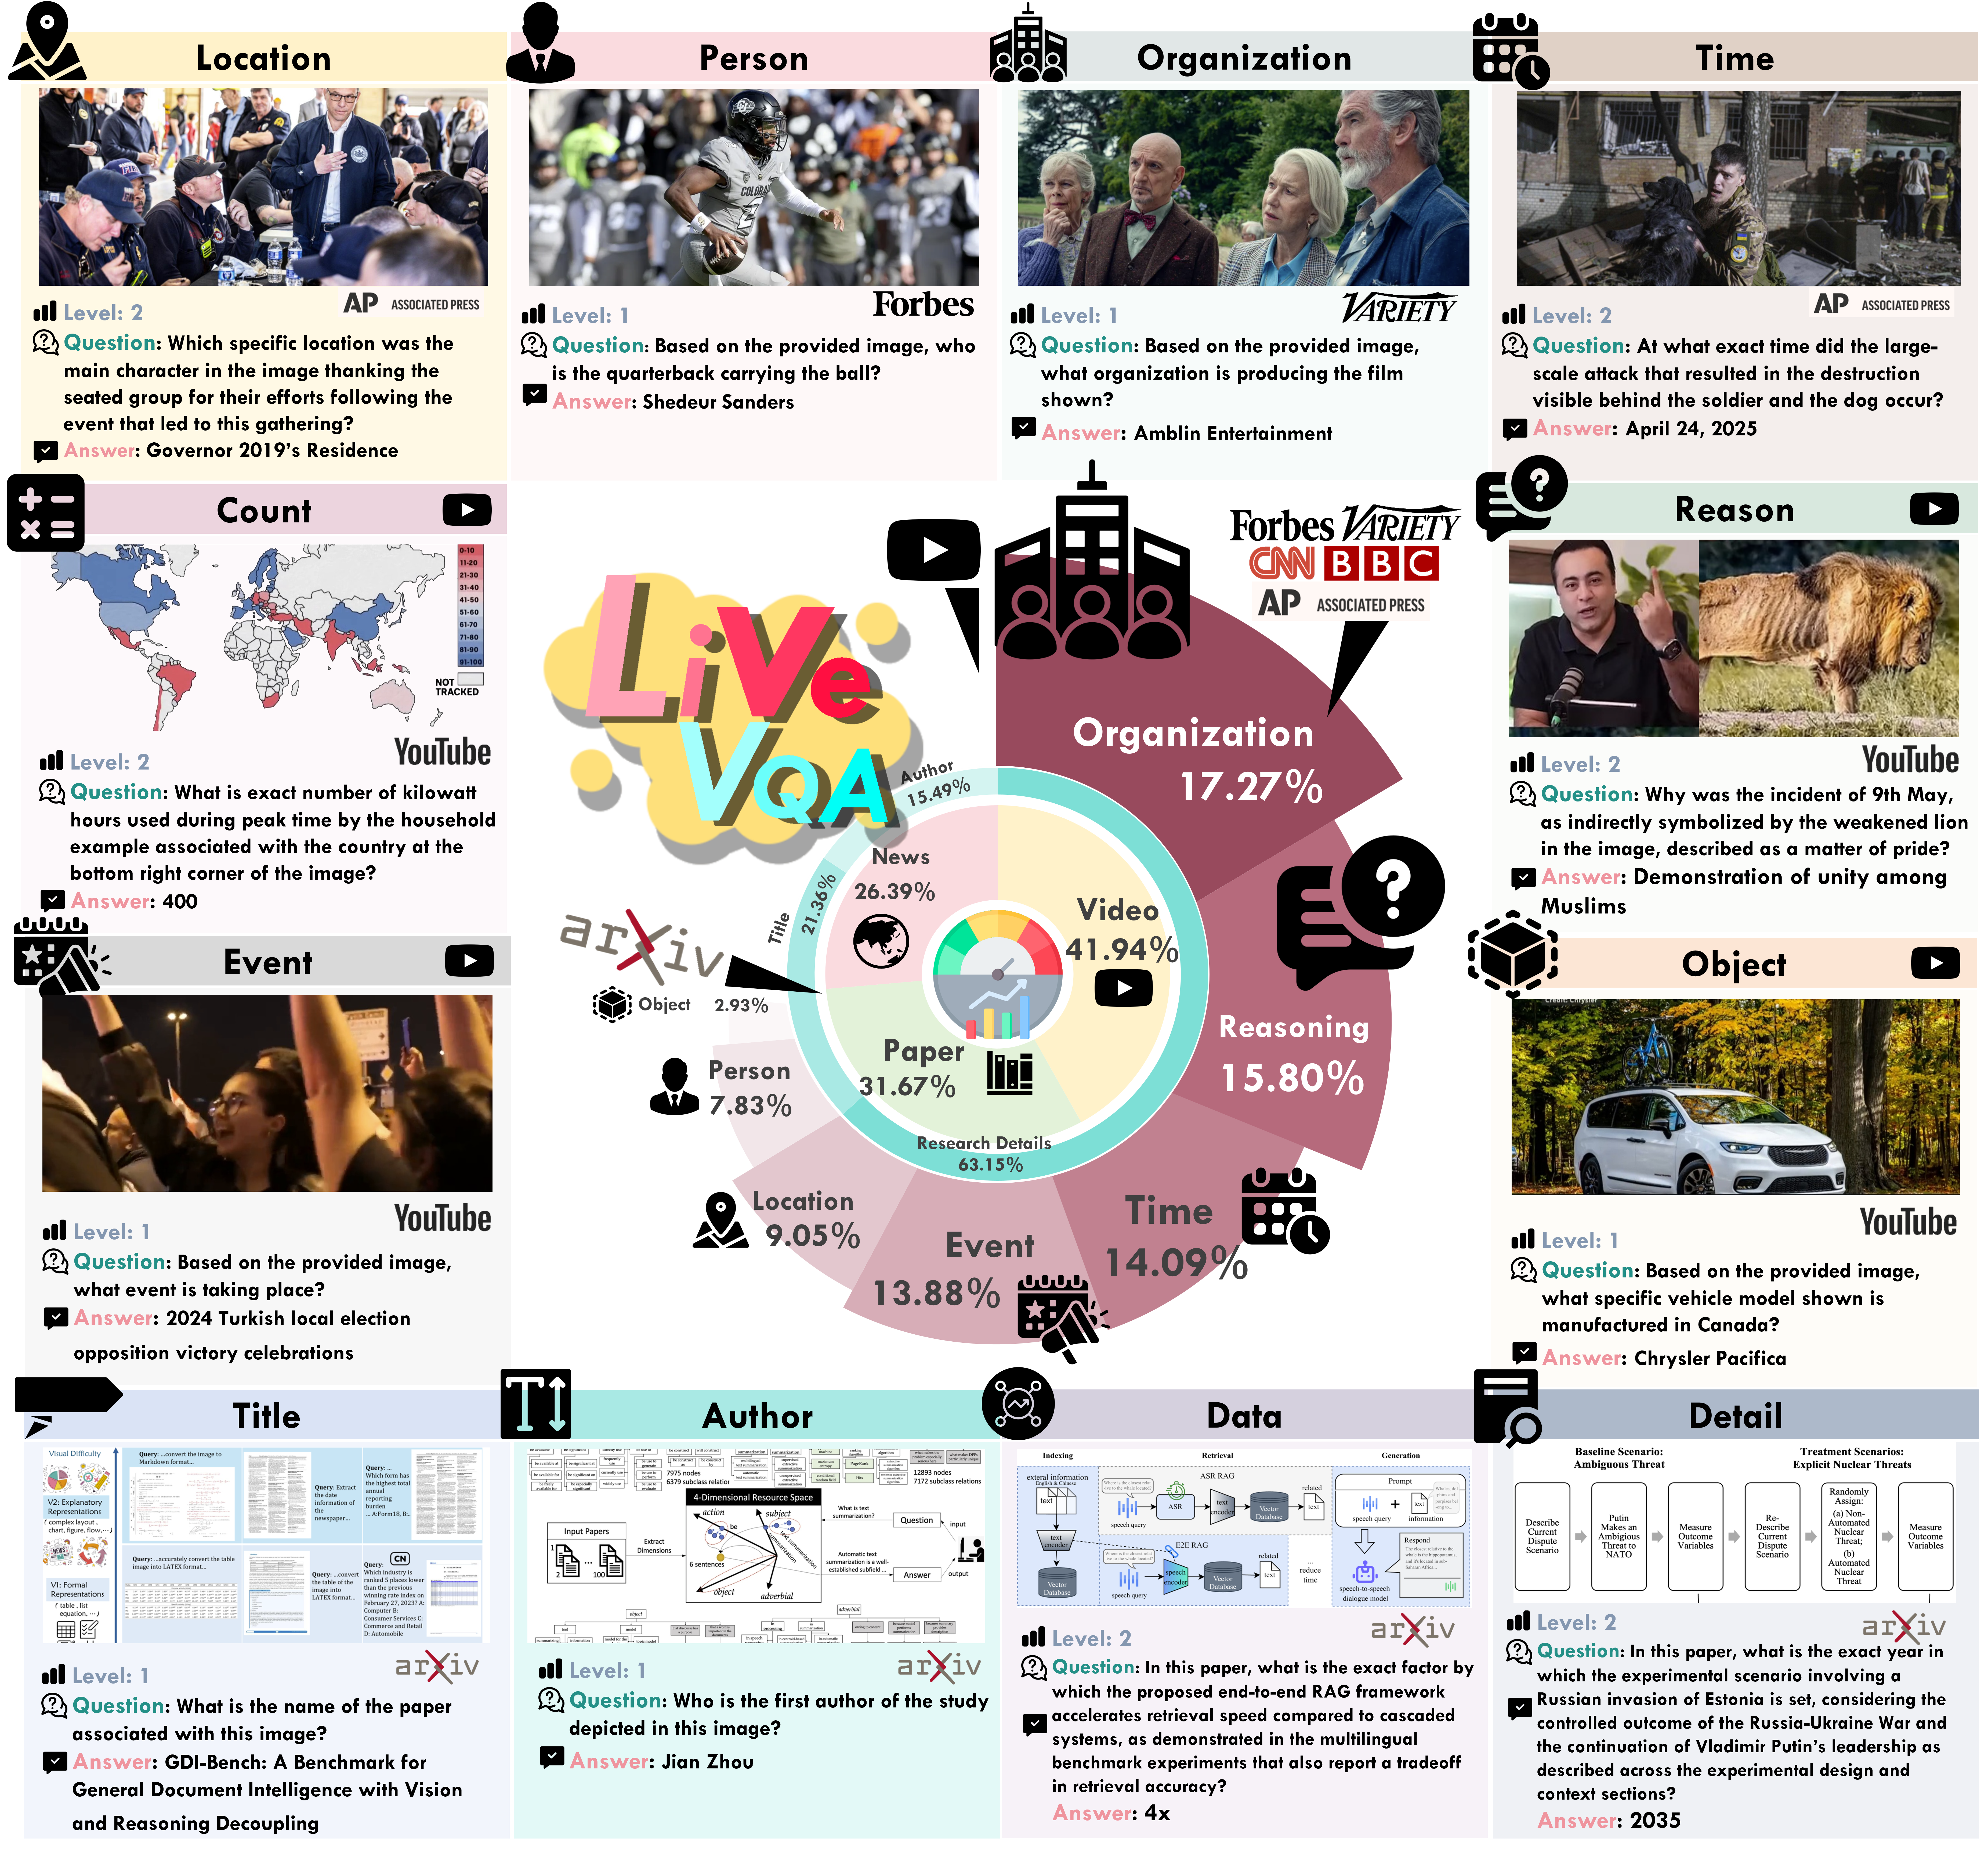
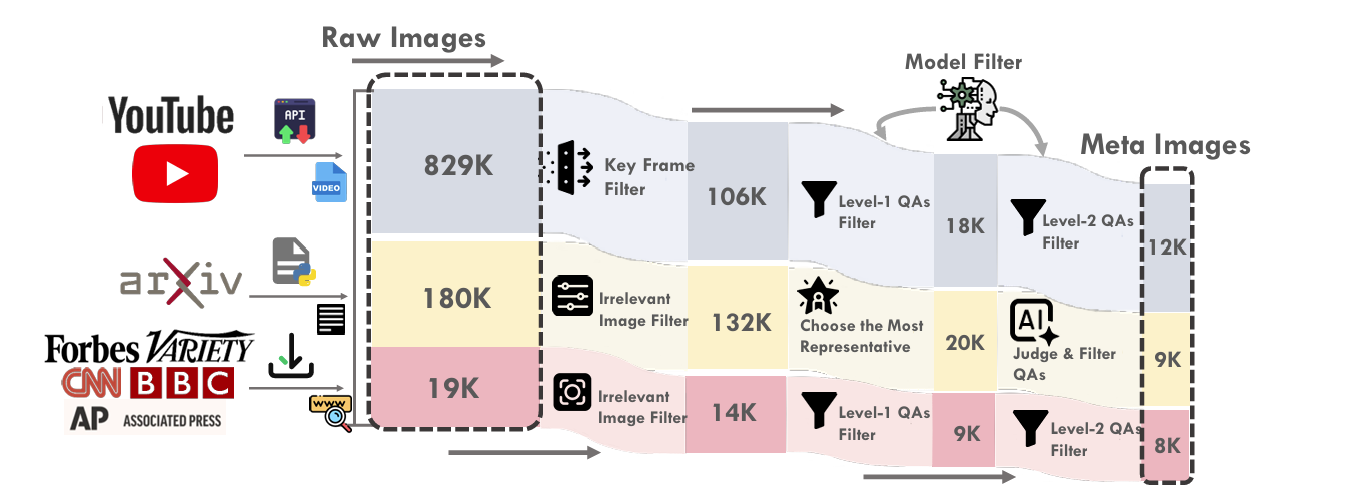
Based on the provided image, what is the specific location where this celebration is taking place?
- A. Augusta National Golf Club
- B. Pebble Beach Golf Links
- C. St Andrews Links
- D. Torrey Pines Golf Course
- E. Pinehurst No. 2
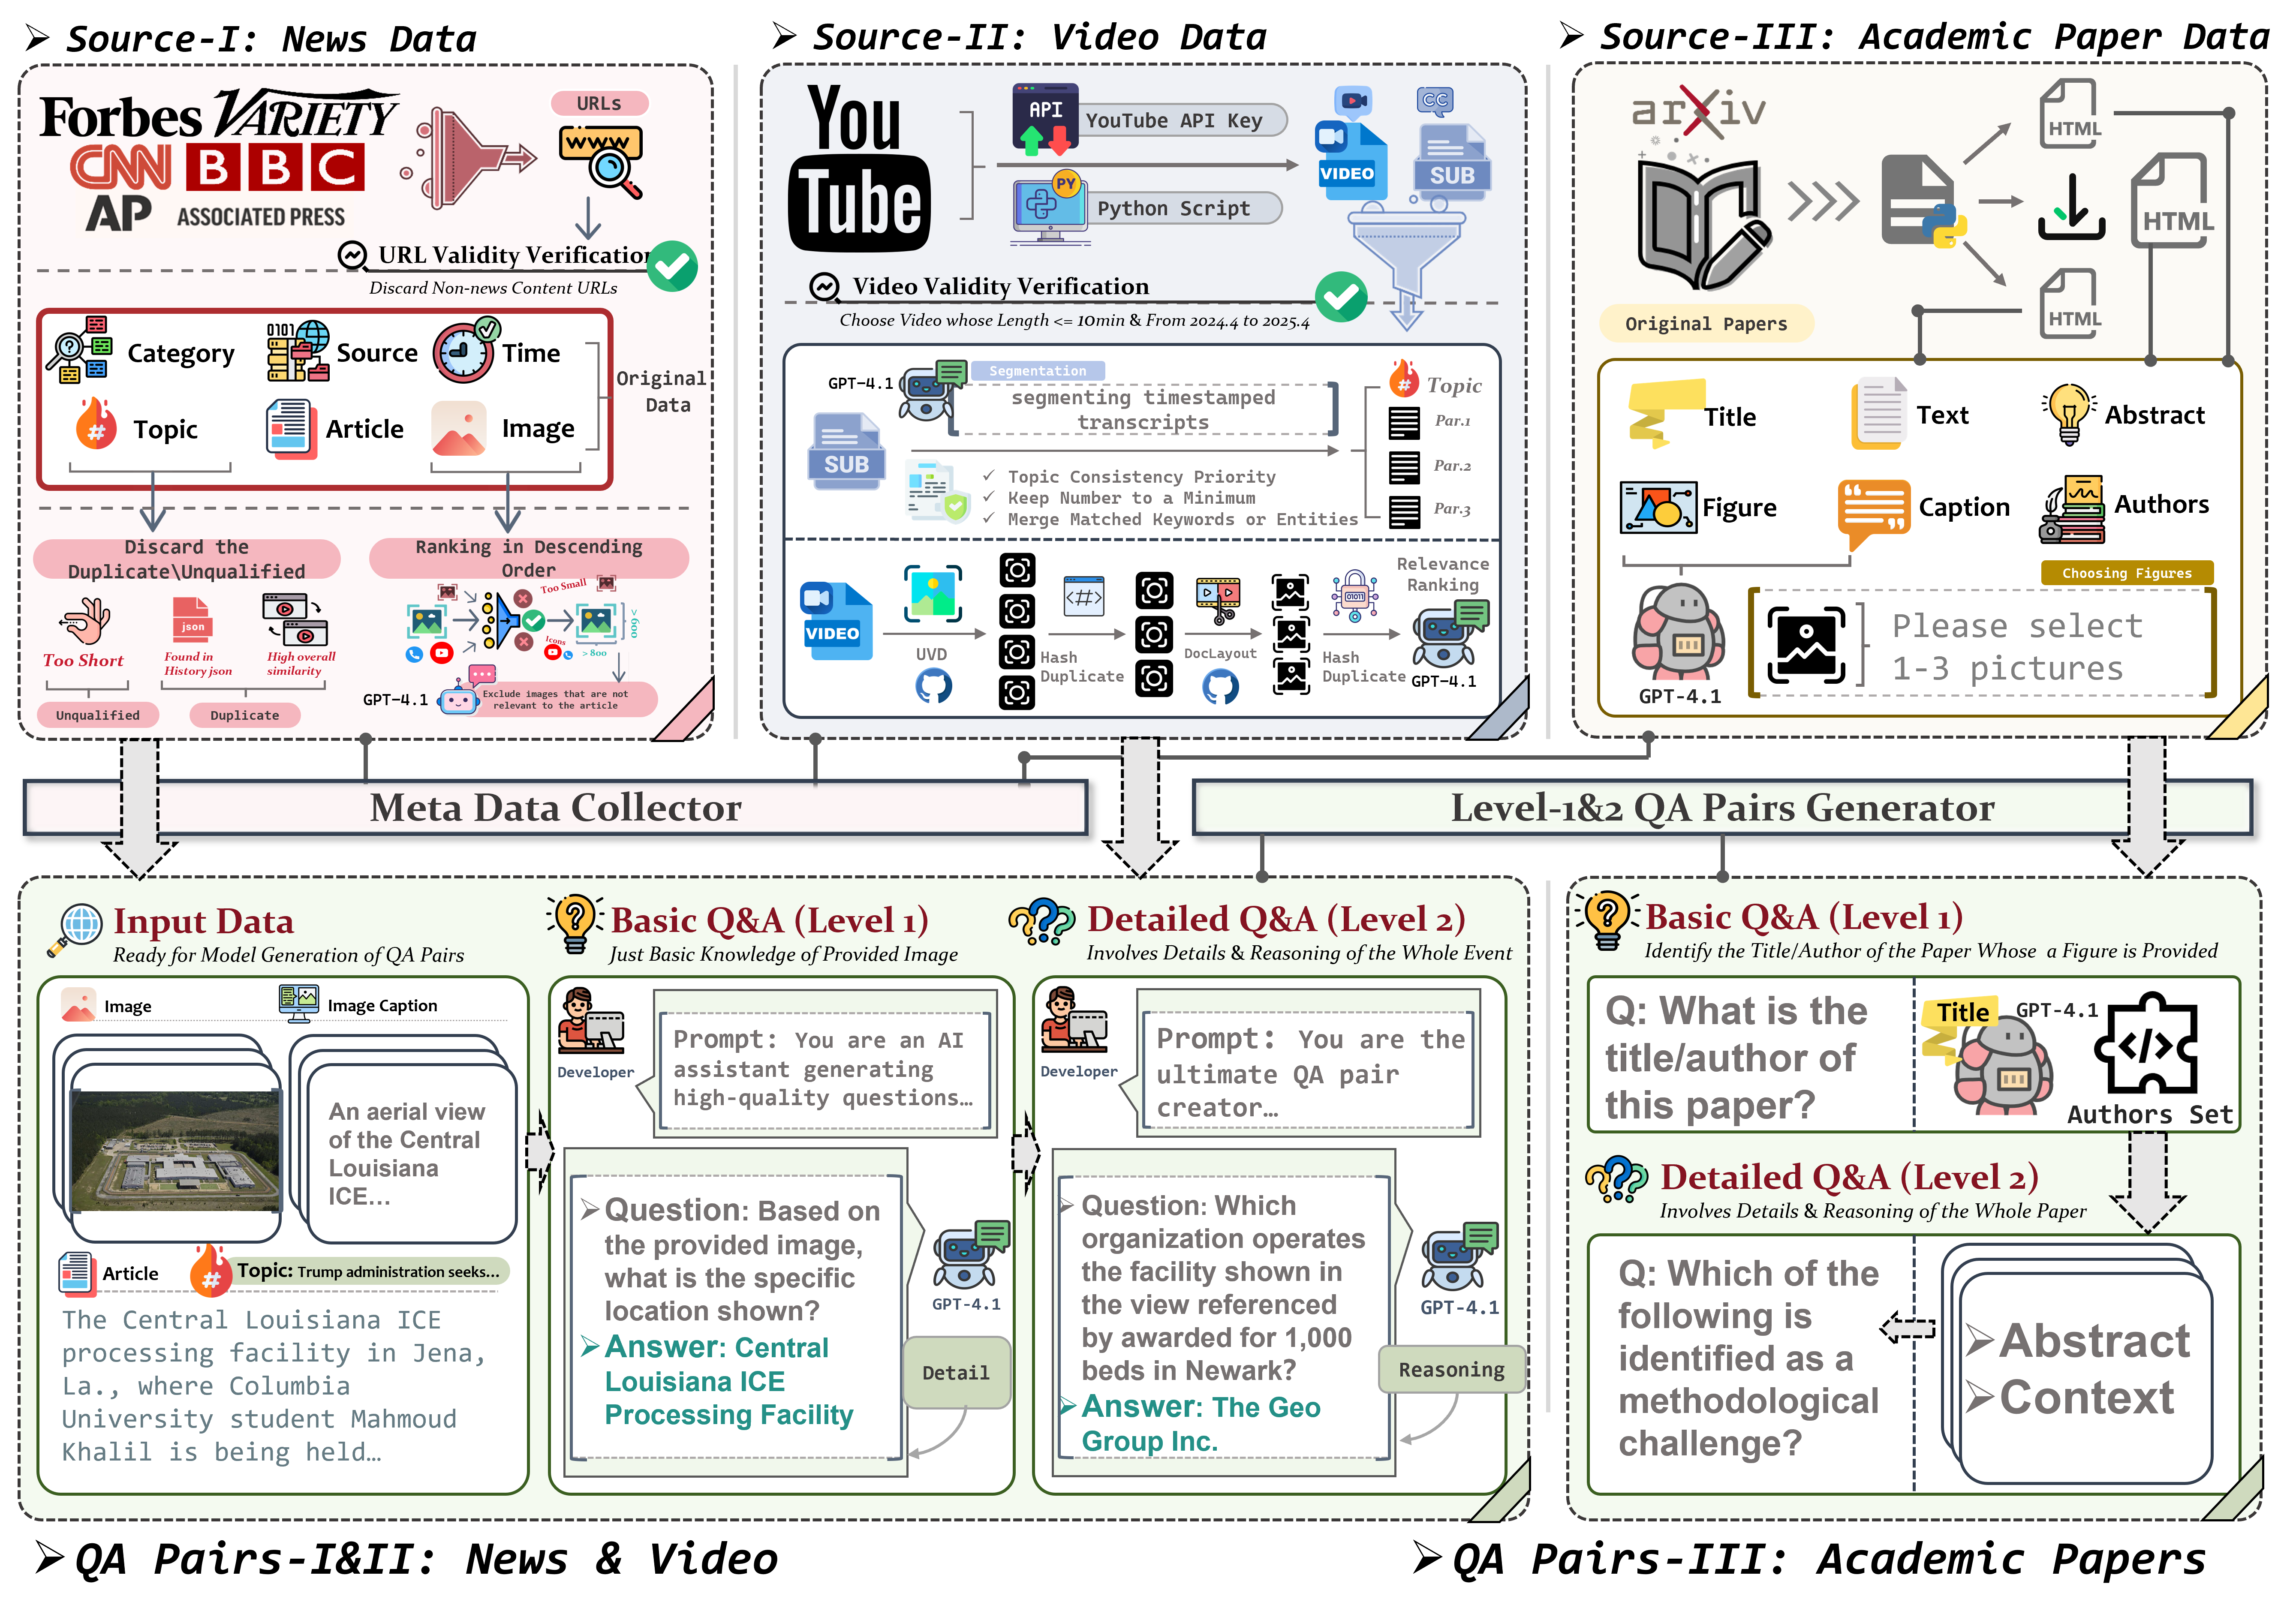
The diagram above illustrates the comprehensive filtering process employed in the construction of the LIVEVQA dataset. It details how raw images and synthesized question-answer pairs are systematically refined across three distinct data source pipelines: YouTube videos, arXiv academic papers, and news articles (from sources such as Forbes, Variety, CNN, BBC, and Associated Press). The pipeline begins with a large corpus of "Raw Images" (e.g., 829K from YouTube, 180K from arXiv, 19K from News). These are then subjected to a series of stringent filtering stages. Key steps include "Key Frame Filters" for video content, "Irrelevant Image Filters" to remove non-pertinent visuals, and "Choose the Most Representative" to select the most informative images. Further refinement occurs through "Level-1 QAs Filters" and "Level-2 QAs Filters", followed by an "AI Judge & Filter QAs" step. This meticulous process significantly reduces the volume of data, ensuring that only high-quality and relevant "Meta Images" and their associated reasoning questions (e.g., culminating in 12K images from YouTube, 9K from arXiv, and 8K from News) are included in the final LIVEVQA dataset. This multi-layered filtering strategy is essential for maintaining the integrity and utility of the benchmark.
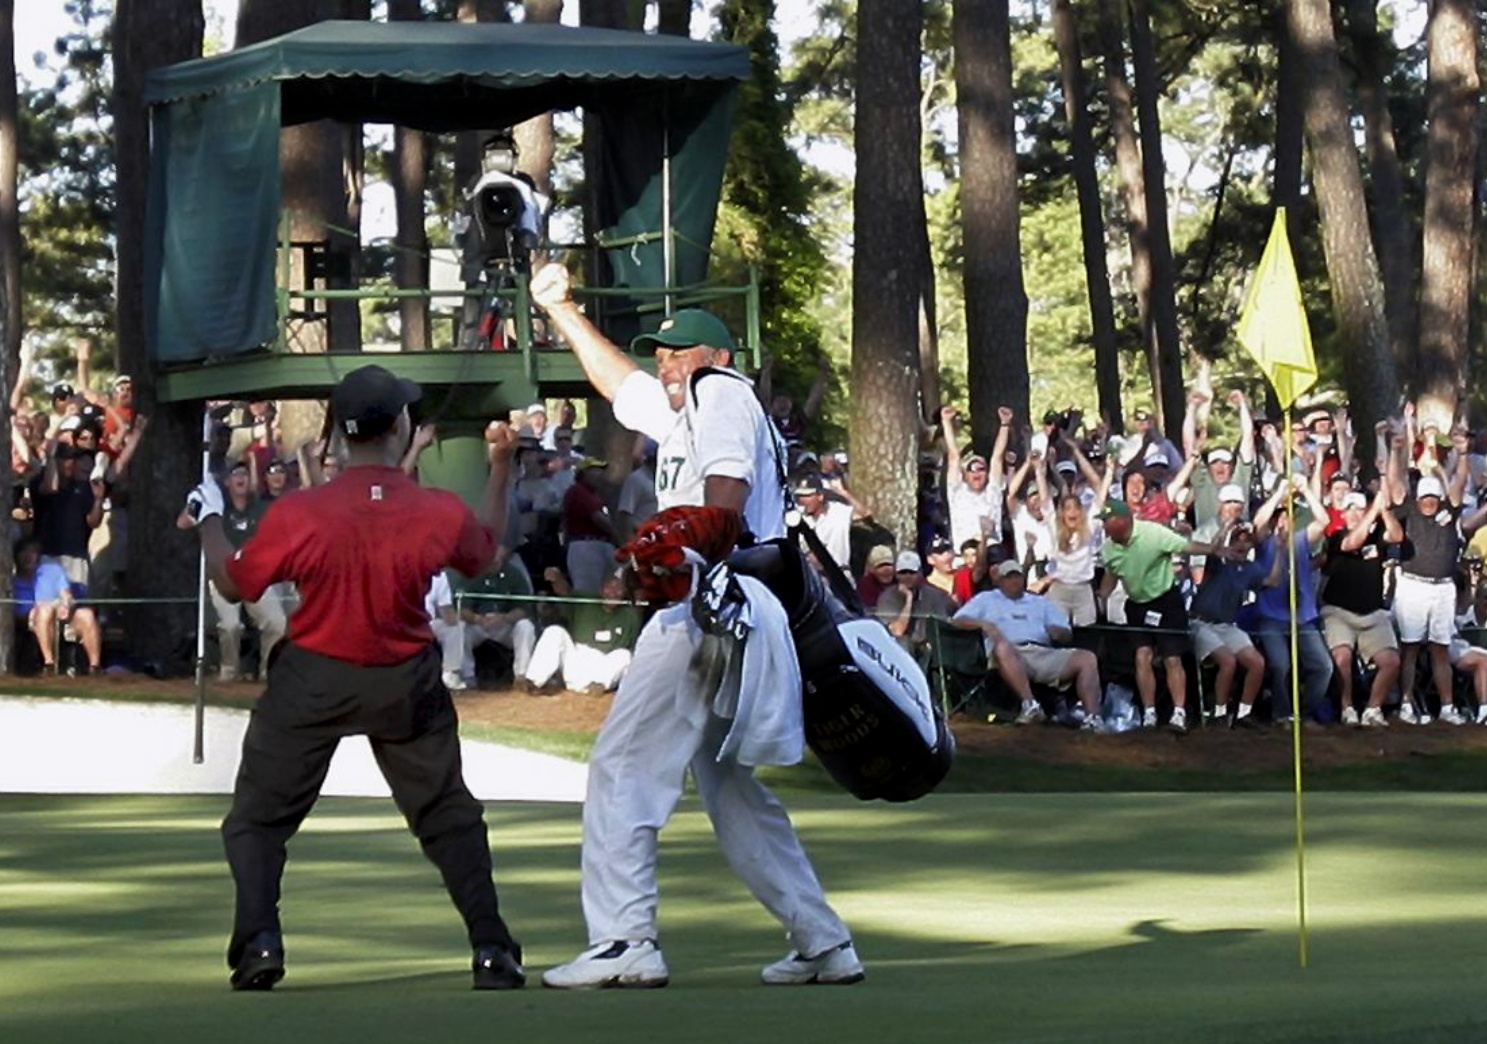
Example 1: News
Source: CNN Sport
Based on the provided image, what is the specific location where this celebration is taking place?
What is the reason the camera operator visible in the green tower above the crowd was able to capture the critical moment shown in the image?
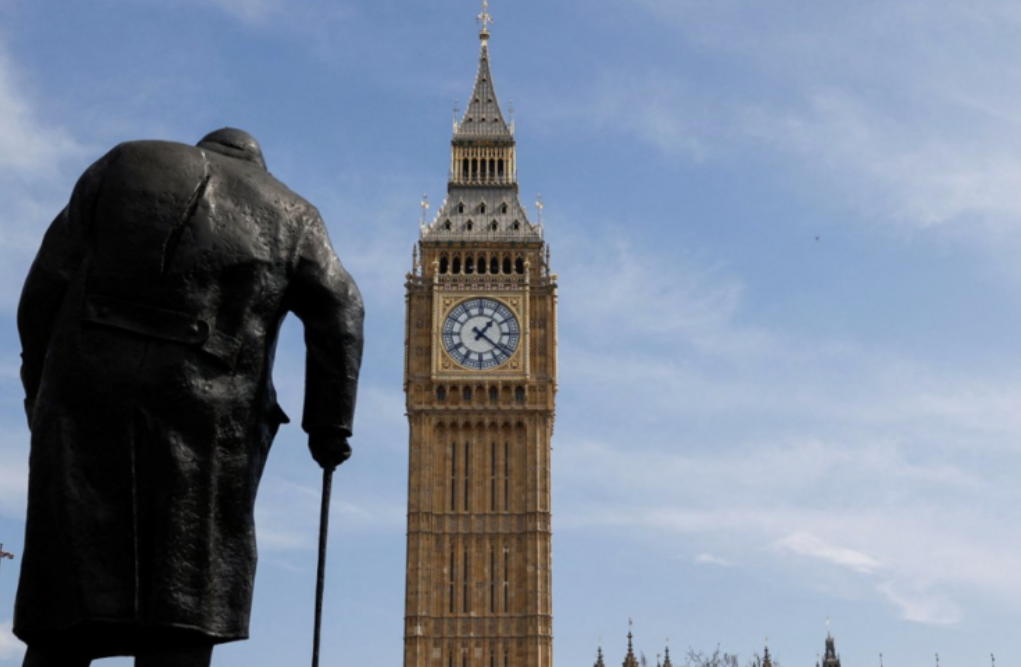
Example 2: News
Source: BBC
Based on the provided image, what is the specific location shown?
Why did the Home Secretary announce the extension of criminal protection to the monument prominently shown in the image?
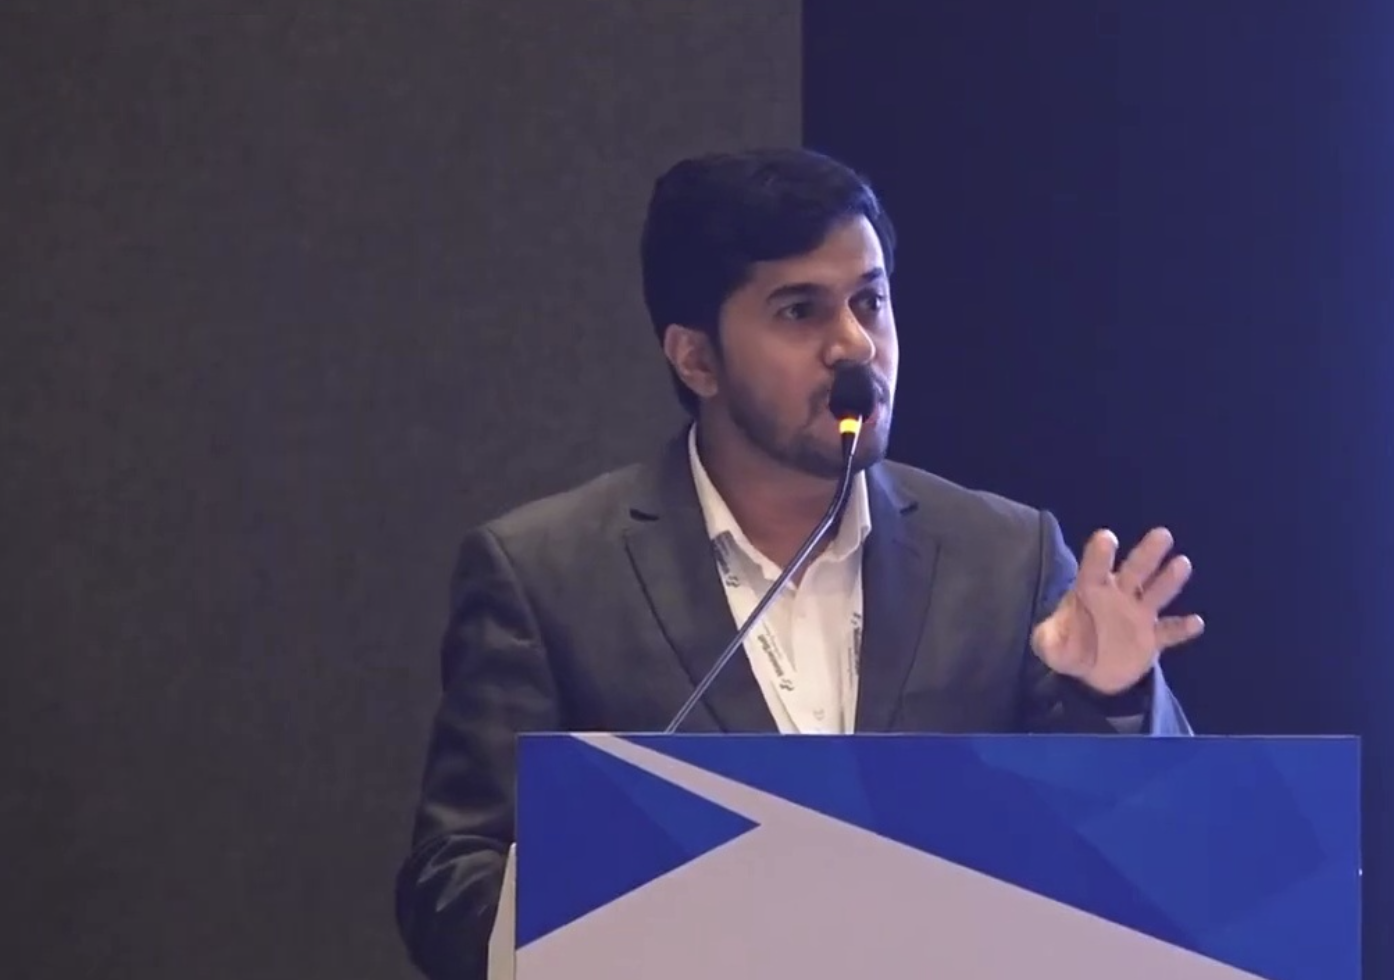
Example 3: Video
Source: YouTube
Based on the provided image, what event is taking place?
How many years was the association mentioned by the principal who took over in 2009 before adopting the solution described by the man at the blue podium?
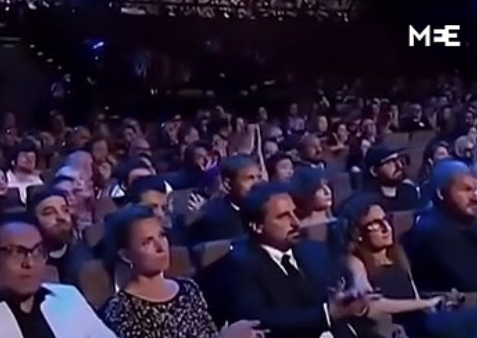
Example 4: Video
Source: YouTube
Based on the provided image, what event is taking place?
What is the name of the event at which the audience shown in the image is present?
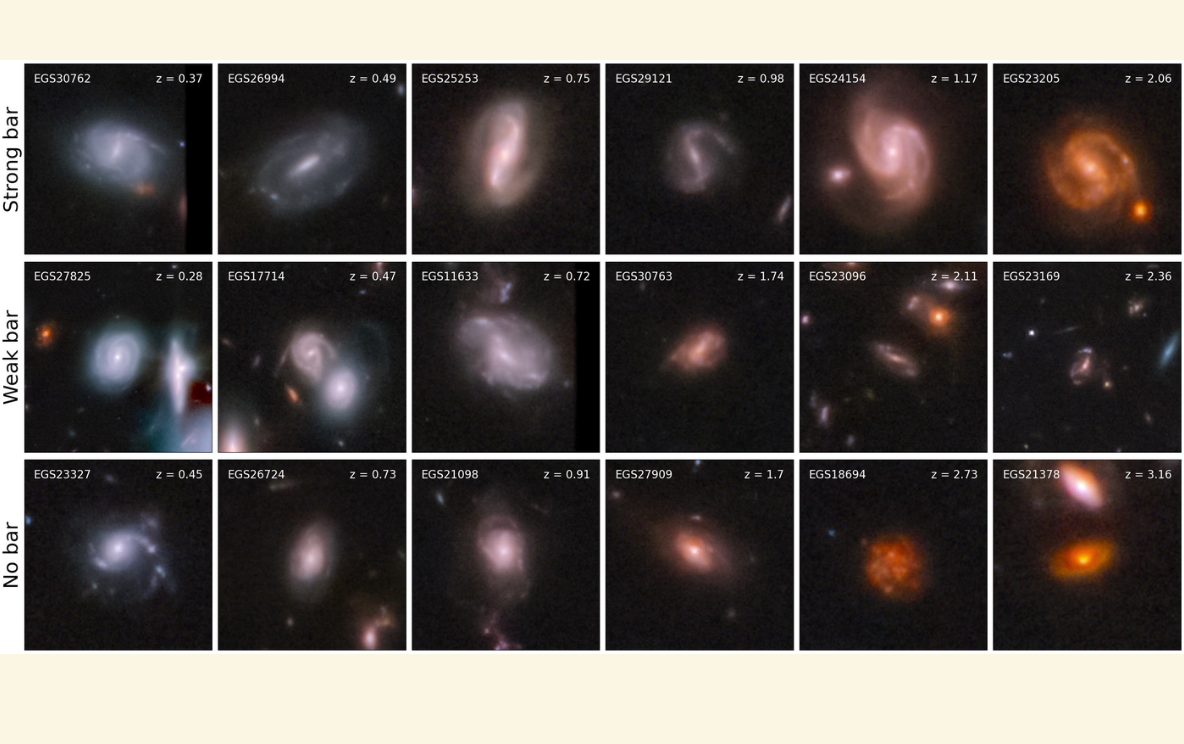
Example 5: Academic Paper
Source: Arxiv
Who is the primary author of the paper shown here?
In this paper, for the sample of 6,640 galaxies that remained after the deduplication process, and based on the described classification scheme (where a galaxy is unbarred if p_strong_bar + p_weak_bar < 0.5), how many galaxies were ultimately classified as unbarred?
Example 6: Academic Paper
Source: Arxiv
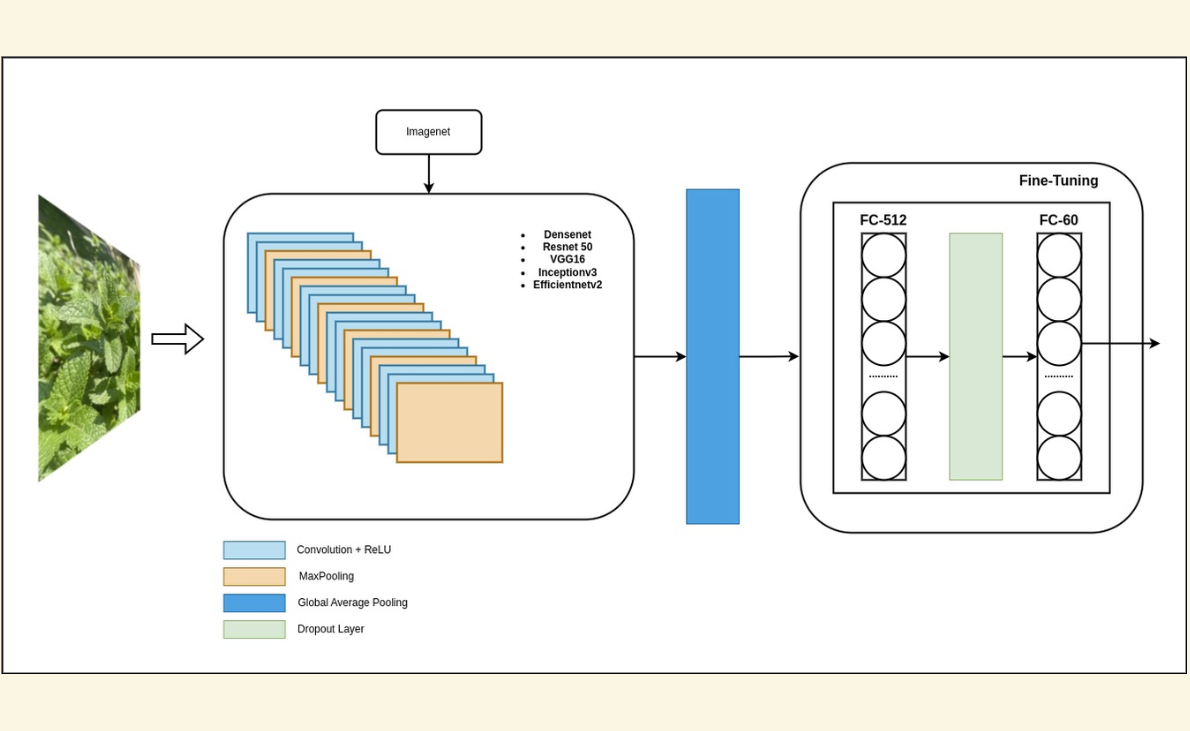
Who conducted the research presented in this image?
In this paper, what is the precise count of distinct, pre-trained architectural frameworks that the researchers explicitly selected, then uniformly adapted at their terminal processing stage for the 60-class herb identification problem, and subsequently benchmarked against one another?
| Category | Images | #Question | Level 1 | Level 2 | Avg. Len. | Purpose |
|---|---|---|---|---|---|---|
| News Article | 7,579 | 38,809 | 7,579 | 31,230 | 749 | - |
| YouTube Videos | 11,948 | 43,168 | 11,948 | 31,220 | 311 | - |
| Academic Paper | 8,961 | 25,166 | 9,456 | 16,205 | 597 | - |
| Avg. per Sample | 1 | 3.86 | 1 | 2.86 | 517 | - |
| Test Split | 1,500 | 3,000 | 1,500 | 1,500 | 544 | Exp. 1 |
| Training Split | 26,988 | 104,143 | 26,988 | 77,150 | 496 | Exp. 2 |
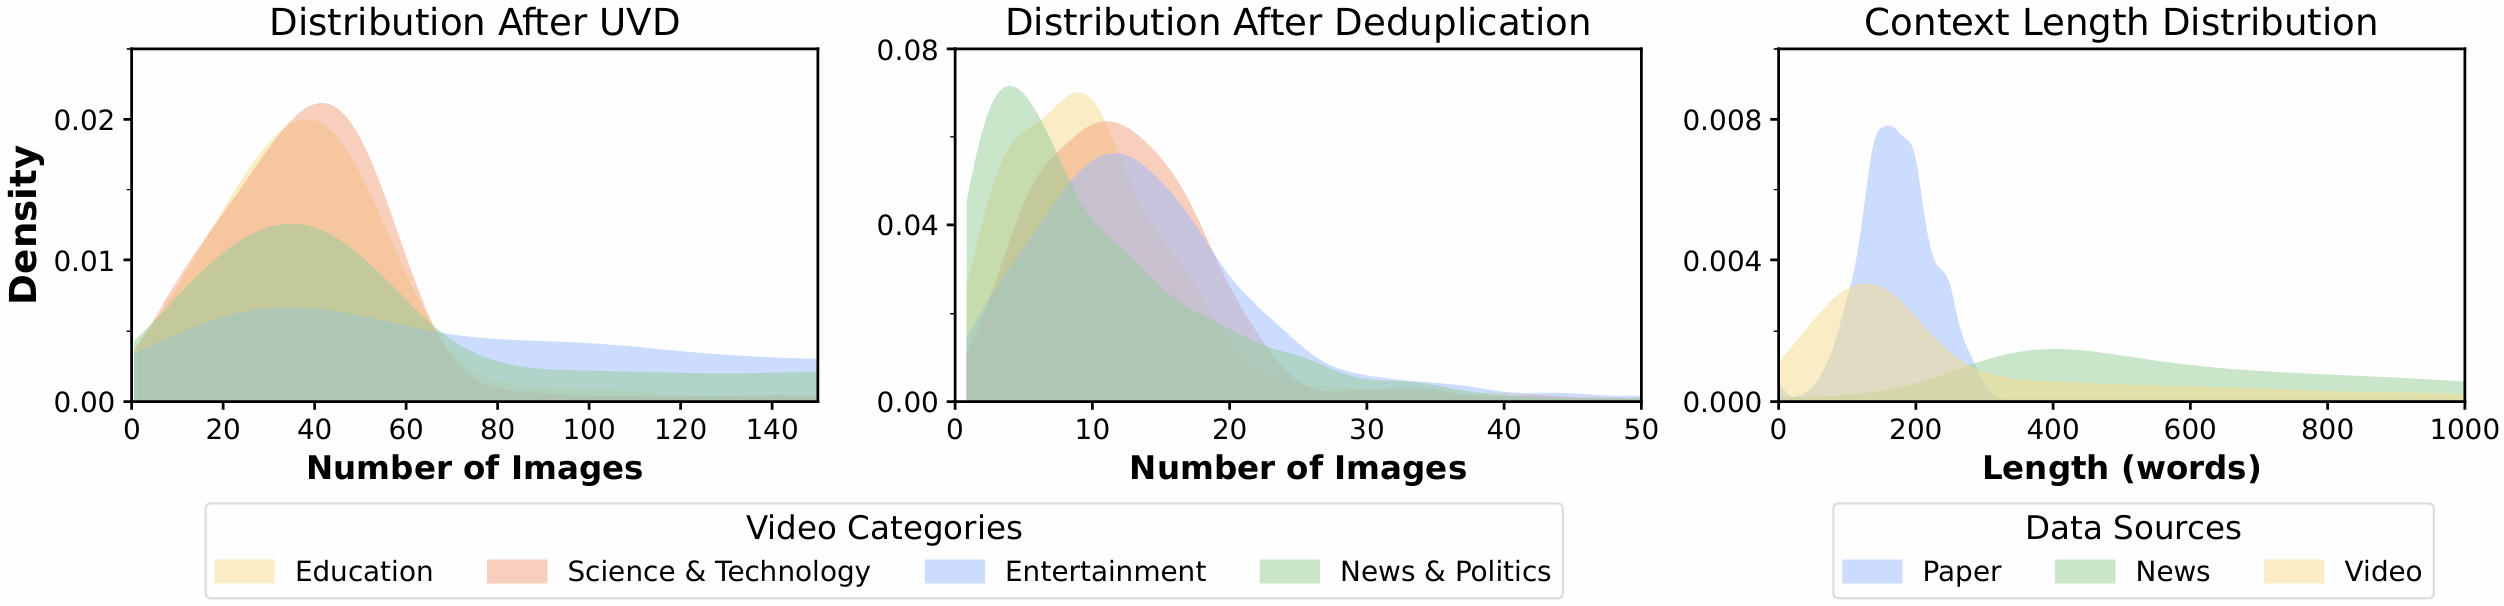
Figure 4: (Left) Image size distribution in YouTube image filtering pipeline. (Right) Textual context length distribution for each question.
| Model | Cutoff | Level 1 | Level 2 | ||||||
|---|---|---|---|---|---|---|---|---|---|
| News | Video | Arxiv | Avg. | News | Video | Arxiv | Avg. | ||
| w.o. Search | |||||||||
| GPT-4.1 | Jun. 2024 | 27.0 | 22.0 | 0.4 | 16.5 | 5.2 | 7.2 | 0.2 | 3.0 |
| GPT-4.1-mini | Jun. 2024 | 24.6 | 19.6 | 0.2 | 14.8 | 4.0 | 7.8 | 0.4 | 4.0 |
| GPT-4.1-nano | Jun. 2024 | 13.0 | 13.0 | 0.0 | 8.6 | 2.2 | 6.0 | 0.4 | 2.9 |
| Gemini-2.5-Flash | Jan. 2025 | 25.8 | 18.4 | 0.8 | 15.0 | 4.6 | 4.4 | 4.0 | 4.3 |
| Gemini-2.5-Pro | Jan. 2025 | 28.0 | 17.4 | 0.6 | 15.3 | 4.4 | 2.4 | 1.2 | 2.7 |
| Gemma-3-27B-It | Aug. 2024 | 21.0 | 16.4 | 1.0 | 12.8 | 3.8 | 4.6 | 6.2 | 4.9 |
| Claude-3.7-Sonnet | Oct. 2024 | 26.2 | 16.4 | 0.6 | 14.3 | 2.2 | 4.4 | 4.4 | 3.7 |
| Qwen-2.5-VL-7B-Instruct | Unknown | 20.2 | 13.4 | 0.2 | 11.3 | 3.8 | 5.4 | 2.0 | 3.7 |
| Qwen-2.5-VL-32B-Instruct | Unknown | 25.2 | 16.4 | 0.4 | 14.0 | 4.2 | 5.6 | 1.2 | 3.7 |
| Qwen-2.5-VL-72B-Instruct | Unknown | 12.4 | 9.4 | 0.0 | 7.3 | 1.4 | 3.6 | 3.6 | 2.9 |
| Llama-4-Scout | Aug. 2024 | 20.6 | 16.4 | 0.0 | 12.1 | 4.0 | 5.0 | 2.8 | 3.9 |
| Llama-4-Maverick | Aug. 2024 | 20.2 | 19.0 | 0.6 | 13.3 | 5.8 | 6.0 | 5.2 | 5.7 |
| w. Text Search | |||||||||
| GPT-4.1 | Jun. 2024 | 25.0 | 21.4 | 0.6 | 15.6 | 3.6 | 5.6 | 3.8 | 4.3 |
| Gemini-2.5-Pro | Jan. 2025 | 17.6 | 9.2 | 0.2 | 9.0 | 2.0 | 1.6 | 1.0 | 1.5 |
| Claude-3.7-Sonnet | Oct. 2024 | 24.6 | 16.6 | 0.0 | 13.7 | 2.0 | 3.6 | 4.8 | 3.5 |
| w. Native Image Search | |||||||||
| GPT-03 | Jun. 2024 | 33.6 | 33.6 | 2.6 | 23.3 | 14.6 | 14.9 | 17.8 | 15.8 |
| w. MM-Search [Jiang et al., 2024] | |||||||||
| GPT-4.1 | Jun. 2024 | 42.0 | 36.1 | 22.0 | 33.4 | 27.2 | 15.2 | 48.8 | 30.4 |
Our comprehensive benchmarking of 17 state-of-the-art Multimodal Large Language Models (MLLMs) on the LIVEVQA dataset revealed significant difficulties in handling visual information beyond their knowledge cutoff dates. For instance, even top-performing models showed low accuracy on recent visual content when operating without external tools.
However, the integration of multimodal search capabilities leads to dramatic improvements.
The research explored updating MLLMs with new visual knowledge using Parameter-Efficient Fine-Tuning (PEFT) methods like LoRA and DoRA.
While PEFT methods allow for efficient incorporation of new visual facts, this process is not without its challenges and trade-offs.
A consistent observation was the degradation in the model's foundational visual perception capabilities (as measured by the MMStar benchmark) after undergoing intensive visual knowledge updates, regardless of rank, training steps, or data formats. For example, models trained using the simple QA format exhibited a performance drop on MMStar from 65.80% to 58.16%. This suggests an inherent conflict between enhancing specific visual knowledge through intensive updates and preserving the model's broader visual perception abilities.
The benchmark results highlighted several aspects regarding model characteristics:
@article{fu2025livevqa,
  title={LiveVQA: Live Visual Knowledge Seeking},
  author={Fu, Mingyang and Peng, Yuyang and Liu, Benlin and Wan, Yao and Chen, Dongping},
  journal={arXiv preprint arXiv:2504.05288},
  year={2025}
}